Overview Tab
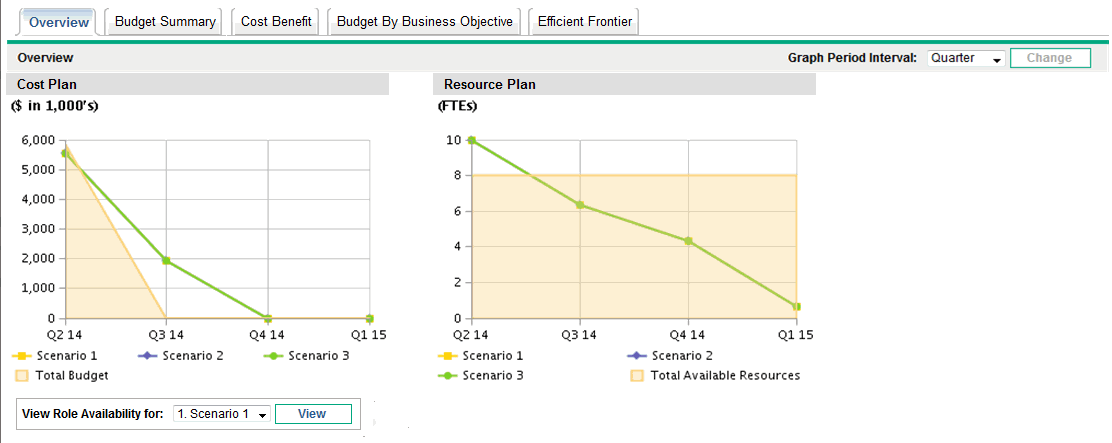
The Overview tab in the Scenario Comparison page provides an overview of the three scenarios in the scenario comparison. See Figure 5-2. Scenario Comparison page, Overview tab.
Figure 5-2. Scenario Comparison page, Overview tab

Unlike most of the other tabs, the Overview tab integrates all three scenarios into each of its two visualizations—the Cost Plan and Resource Plan graphs, as follows:
-
Cost Plan. Each scenario line in the Cost Plan graph shows, for each period, the sum of the costs attached to all the lifecycle entities selected for that scenario. For information about the cost calculations, see Overview of the Scenario Comparison Page.
If a supply budget has been specified in the basic information section above the tabs, the graph includes the supply budget as the Total Budget line, with solid color underneath. For information about specifying the supply budget, see Changing a Scenario Comparison's Basic Information.
-
Resource Plan. Each scenario line in the Resource Plan graph shows, for each period, the resources required for that scenario, based on the sum of the total resource requirements from all the staffing profiles attached to all the lifecycle entities selected for that scenario.
If the Calculate Total Available Resources for comparison from the following Resource Pools field has been specified in the basic information section above the tabs, the graph includes the sum of the resources in those resource pools as the Total Available Resources line, with solid color underneath. To specify this field, see Changing a Scenario Comparison's Basic Information. The resource supply you specify for the scenario comparison need not be related to the resource demand represented by the set of staffing profiles attached to the lifecycle entities in a scenario.
You can also view the role availability for a particular scenario and determine at a glance where and when particular roles are needed. For more detailed information, see Viewing Role Availability and Requirements for a Scenario.
Note: In any period, a scenario's required budget or resource can exceed the supply budget or resource specified for the scenario comparison. You can run a scenario optimization program with various options for objectives and constraints, and the program ensures that the optimized scenario does not exceed the supply budget or resource you specify. See Running Scenario Optimizations.
The graphs on all the tabs (except the Efficient Frontier tab) use the same time interval for their horizontal axes. To change the time interval, on any of these tabs select a new value in the Graph Period Interval field and click Change. See Figure 5-3. Graph Period Interval field.
Figure 5-3. Graph Period Interval field


