Analyze resource pools
This topic describes how to analyze resource pools against staffing profiles.
Overview
Resource capacity planning typically involves the use of both resource pools and staffing profiles. The projected capacity of resources is tracked with resource pools, while anticipated demand is tracked with staffing profiles. Comparing a resource pool to a staffing profile, you can obtain insight on future resource deployments as they are weighed against planned resource capacity.
Compare resource pools to staffing profiles
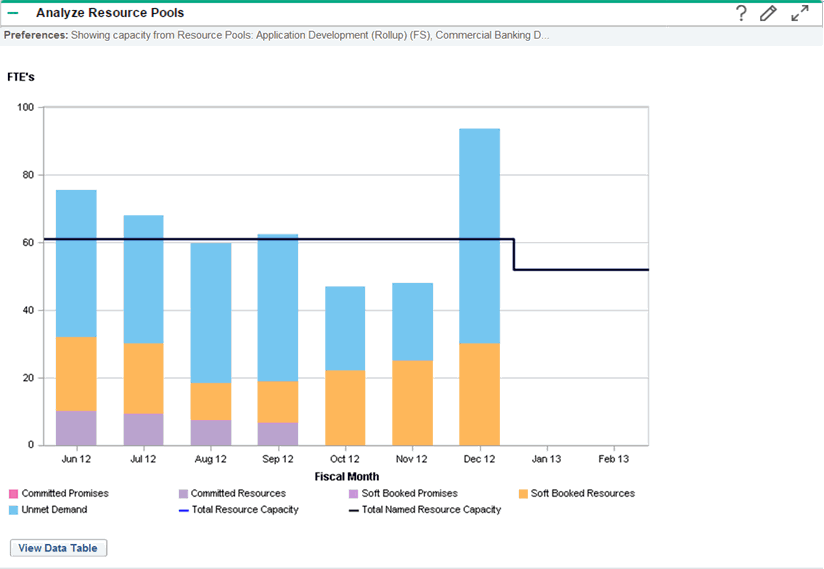
You can use the Analyze Resource Pools portlet to compare the projected demand in one or more staffing profiles to projected capacity in one or more resource pools.

To understand the portlet:
The Analyze Resource Pools portlet includes the following UI elements:
| UI element | Description |
|---|---|
| The blue line |
Represents the total capacity of the resource pool or pools being analyzed. |
| The black line | Represents the total named capacity of the resource pool or pools being analyzed. |
| Bars on the chart | Represent resource allocations from staffing profiles by period, which can be split internally by staffing profile or status. |
| View Data Table | Opens the Analyze Resource Pools Breakdown table, from which you can obtain a more numerically precise breakdown of projected load distribution. For details, see Analyze Resource Pools Breakdown table. |
To filter the portlet data:
Use the parameters described in the table below to filter the Analyze Resource Pools portlet data:
|
Field Name |
Description |
|---|---|
|
Filter By |
|
|
Analyze Capacity from Resource Pools |
A multi-select auto-complete field that enabels you to select the resource pool or pools to analyze. |
| Include all Resource Pools managed by myself |
Available in PPM 10.0.2 and later versions. Select this check box to include all the resource pools managed by yourself. |
| Do not include child Resource Pools |
Available in PPM 10.0.2 and later versions. Select this check box to exclude child resource pools of the selected resource pool or pools from the analysis. |
|
Include (only) Staffing Profiles with Status |
Displays only the staffing profiles with the specified statuses. |
|
Staffing Profiles with Workload Category |
Displays staffing profiles of the specified workload category. |
|
Include (only) Lines from Resource Pools and Staffing Profiles with Specific Role |
A multi-select auto-complete field that enables you to select a role or set of roles to display from the resource pools and staffing profiles being analyzed. |
|
Time Period |
|
|
Period |
Selects the time period used by the Analyze Resource Pools portlet such as Weeks, Day, Quarters, Month, or Year. |
|
Display (x) past periods |
Selects up to 20 time periods before the current date to include in the Analyze Resource Pools portlet. If the period is yearly, selects up to 12 time periods. Useful for viewing historical trends. |
|
Display (x) future periods |
Selects up to 20 time periods after the current date to include in the Analyze Resource Pools portlet. If the period is yearly, selects up to 8 time periods. |
|
Arrange Data |
|
|
Group By |
Groups the data by Staffing Profile or Committed, Soft-booked, and Unmet Demand. |
Analyze Resource Pools Breakdown table
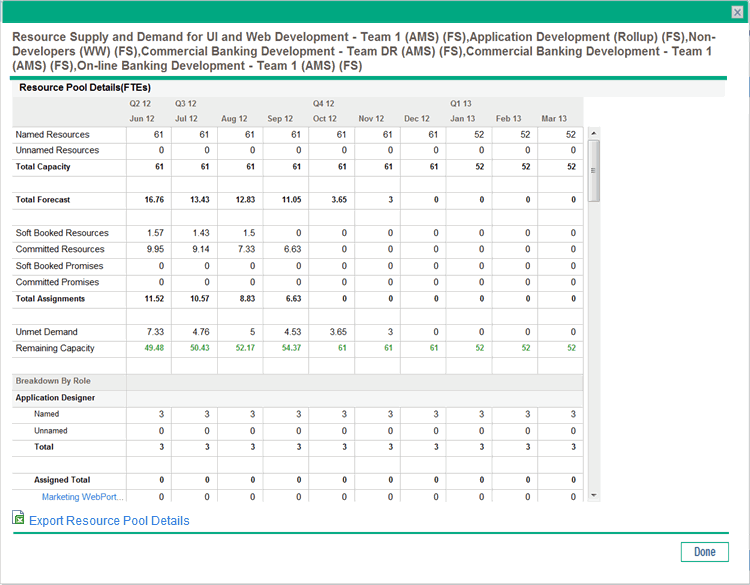
You can use the Analyze Resource Pools Breakdown table to obtain a more numerically precise breakdown of projected load distribution. To open the table, click View Data Table at the bottom of the Analyze Resource Pools portlet.

Note: For parent resource pools, the capacity line includes the FTEs from all child resource pools as well, meaning all roll-up lines are included. Similarly, the resource allocation bars represent all staffing profiles that draw from the child resource pools.
You can have multiple instances of this portlet on your PPM Dashboard, to keep track of different resource pools. You can also export the figures to Microsoft Excel for further manipulation.
The following table describes the columns in the Analyze Resource Pools Breakdown table.
|
Row |
Description |
|---|---|
|
Named Resources |
Maximum amount of effort that can be allocated for named resources. |
|
Unnamed Resources |
Maximum amount of effort that can be allocated for unnamed resources. |
|
Total Capacity |
Maximum total amount of effort that can be allocated for named and unnamed resources. |
|
Total Forecast |
Anticipated demand for named and unnamed resources. Note: The Total Forecast is calculated based on the position associated pool calendar. |
|
Soft Booked Resources |
Amount of effort provided by allocated resources that are not yet committed. |
|
Committed Resources |
Amount of effort provided by allocated resources that are committed. |
|
Soft Booked Promises |
Amount of effort provided by promised resources that are not yet committed. Viewable if the |
|
Committed Promises |
Amount of effort provided by promised resources that are committed. Viewable if the |
|
Total Assignments |
Total effort provided by allocated and promised resources that are soft-booked and committed. Note: The Total Assignment is calculated based on the assigned resource associated resource calendar and the project's Cost and Effort settings:
For details, see Cost and effort policy. |
|
Unmet Demand |
Amount of effort needed from unallocated resources. It is displayed in different dimensions based on the settings of period type (how the time period is divided) and effort type (how the effort is measured). Unmet Demand = Total Forecast – Total Assignments. For examples about how to use Unmet Demand Calculation in different scenarios, see Unmet demand calculation sample scenarios. Tip: A special case on unmet demand calculation is on the resource pool view forecasted demand page. The negative unmet (that is, an overbooking on one position) is ignored while showing unmet demand for the entire resource pool. This is because when we focus on the real unmet demand for a resource pool, we may not want the negative unmet demand for position 1 to offset the positive unmet demand for position 2 for a given period. |
|
Remaining Capacity |
The available capacity of the selected resource pool. Remaining Capacity = Total Capacity – Total Assignments |
|
Breakdown by Role |
|
|
Named |
Maximum amount of effort that can be allocated for named resources for the specified role. |
|
Unnamed |
Maximum amount of effort that can be allocated for unnamed resources for the specified role. |
|
Total |
Maximum total amount of effort that can be allocated for named and unnamed resources for the specified role. |
|
Forecast Total |
Anticipated demand for named, unnamed, and promised resources for the specified role. |
|
Assigned Total |
Total amount of effort that is allocated for named, unnamed, and promised resources for the specified role. |


